Thursday, 27 September 2018

Microsoft Project - Customising Reports


Customising Reports

Reports can be customised where the report can be seen.

1.     To display the reports go to Menu Reports, Reports

2.     Select the category of reports required


3.     Select the report and then click on the edit button.

This gives you information as to how the report is put together.

The definition is where the main details of the report are. In this example the report shows which resource is working on which task when. From the definition the report is broken down on a day by day basis. It can be changed to weeks, months qtrs etc.
Details and Sort will allow you to fine tune the report as necessary.

4.     Make the adjustments as necessary.


 5.     OK the changes. This takes you back to the previous screen.
 6.     Select the report to view the changes.


By changing the existing reports they can still be accessed via the five categories of reports.

Microsoft Project Visual Reports


Project Visual Reports

This is a new feature in Project 2007, but to be able to use this feature you need .net framework 2, Excel 2007 and Visio 2007 installed. If you do not have these installed they will not work.
The advantage of using Visual reports is that the reports can then be manipulated in Excel using pivot tables and charts and Visio.


Create the Visual report


1.     Menu Reports, visual reports

2.     Select whether to see Excel, Visio or both type of reports

3.     Select report required in either the all categories or from the type of report required.

4.     Click on View

This opens up the report in Excel or Visio where it can be manipulated independently.


Microsoft Project - Printing Reports


Printing reports

Reports are already set up in Project. They come in five categories from where a report can be selected.
They can be accessed by Menu, Reports, Reports


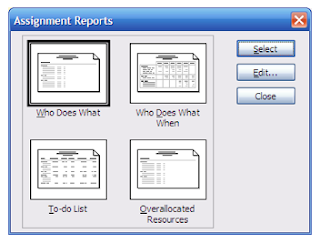
Then the type of report can be selected by double clicking on the section required.


The required report can be selected.

Notice the picture that is visible for Cash Flow, it is different to the others. Cash flow is a cross tab report. Whereas the other reports are list reports.
The list reports are based on tables to control the combination of columns being displayed, and filters to control the tasks being displayed.
By editing the reports the order in which the tasks are listed can also be changed.