
Introduction to Microsoft Power BI
It all starts with the dataset, which simply means the data you have connected to. These datasets are then added to reports as visualizations, which present that data in a graphical way.
The Power BI web and mobile apps go a step further with dashboards, which allow you to collect visualizations from different reports into a single location.

Each dashboard is made up of tiles, which are simply visualizations linked back to the original report. These dashboards can be collected into workspaces.
For example, sales by region might be presented as a map, with a bubble representing each amount:

The Query Editor Interface
On the left (1), you will see a list of queries, with the data displayed in the center pane. Its settings can then be modified using the commands on the ribbon (2). These settings are listed in the Query Settings pane (3), which we will take a closer look at in a moment. Once you have finished making your changes, click Home→ Close & Apply (4).
Managing Report Pages
Showing and Hiding Pages
To temporarily hide a page, right-click its tab and click Hide Page:

The page tab will then be grayed out. You can show it again by right-clicking the page tab again and de-selecting Hide Page.
You can use this same right-click menu to duplicate the current page, rename the page, or delete it
Changing Page Order
To change the order of pages, simply click and drag the tab:
Release your cursor when you have reached the desired location.
Navigating Through Pages
To view a different report page, simply click its tab at the bottom of Report view:

The Web App Interface
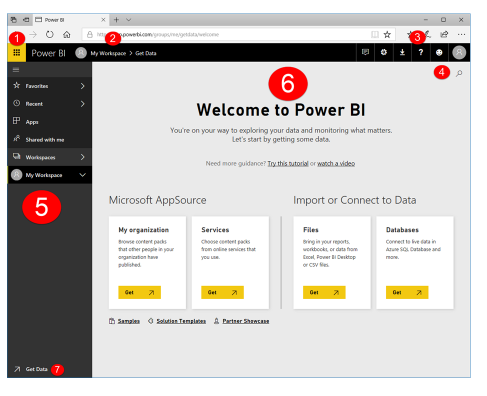
1. App Launcher
2. Breadcrumb Trail
3. Office 365 Commands
4. Search field
5. Navigation pane
6. Canvas
7. Get Data
No comments:
Post a Comment