Wednesday, 30 January 2019

Microsoft Project - Tasks - Milestones

Milestones 

A milestone is a marker or pointer to mark an important point within the project.  Milestones can be inserted into the project at any one or many points.  They will be shown differently on the Gantt Chart. (a black diamond on the standard view).  Milestones can also be filtered out so that they are the only things displayed.

Milestones are usually formatted differently so that they show the dates on the Gantt Chart.

A milestone at the end of the project will show the finish date on the chart rather than trying to guess the value up at the timescale.

To create a milestone 

1. Enter the milestone name as a task

2. Change the duration to 0 (zero)

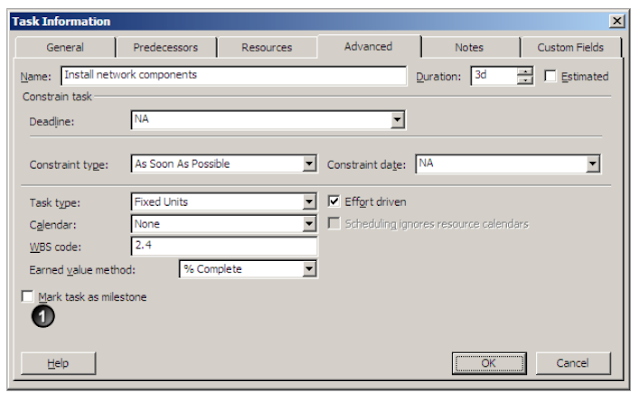
The changing of the duration is what converts a normal task to a milestone. Another way of making a task into a milestone is to do it via the task information


On the advanced tab, in the bottom left corner a task can be marked as a milestone, but the task will still keep its duration.

Microsoft Project - Tasks - Linking Tasks

Linking Tasks 

When entering tasks initially they all start on the same day.  The finish date is dependent on the durations entered against each one.  Rarely on a project do all the tasks start on the same day, they are more likely to dependent on one task finishing before the next task can start.  To carry this out the tasks have to be linked.  There are many ways of linking tasks- the method that you use is the one that you find most convenient.

The button 

Select the two tasks to be linked and click on the link button

If several tasks in consecutive cells all follow on from one another in sequence they can all be selected before the click on the link button.

If the tasks to be linked are not next to each other (i.e. non-contiguous) -  select the first task as normal and hold down the ctrl key when selecting the other tasks to be linked.  Once all the tasks to be linked have been selected let go of the ctrl key before clicking on the link button.

Mouse 


Point to the first task and get the four headed arrow, then drag to the task that the original task is succeeded by. - this will bring up a description box showing which task is linked to which - once the information in that box is correct let go of the mouse button.

Entry in the table -­‐ predecessors column. 

In the predecessors column type in the id number of the task that precedes the current task.  If there are multiple predecessors, separate them by commas.

The Different types of Link 

The links that have been generated so far have all been of the standard type.  This is not always the case.  There are four different types of link that can be generated.

1. Finish to Start (FS)

This is the standard type of relationship where one task finishes and the second task starts.  If the first task does not finish when required it will cause a delay as to when the second task can start.


2. Start to Start (SS)

The start to start relationship sets it up so that the starting point of the second task is dependent upon the starting point of the first task, and if that is postponed for any reason the second task will also be delayed automatically.


3. Finish to Finish (FF)

The finish to finish relationship has the two tasks finishing together and the second task cannot finish until the first task finishes.


4. Start to Finish (SF)

The relationship of this type of link is slightly more complex.  The starting point of the first task is controlling the finishing point of the next task.  (notice the direction of the link line)


Setting the different types of relationship 

Changing the type of link cannot be done when setting up the link using the link button.

Mouse

Once the link has been established.  Double click on the link line.  The dialogue box below will appear on the screen


From the drop down next to the Type box select the type of link required.

Entry in the table - predecessors column 

When entering the id number in the predecessor column follow the number with the two character code for the type of link required.  When a simple finish to start link is required the code is not required as it is automatically assumed.

The Task Information Dialog Box 

When the preceding task information is entered into this dialogue box the information on the type of link can be altered in the next column along - again choosing from a drop down menu.


Microsoft Project - Tables

Tables 


Table control the combination of columns that are shown on the task sheet.  The default table on Project is the Entry Table.  This table allows you to enter the sort of data that is required to set up a Project.

Once a project has been set up then other information might need to be seen.  The schedule table shows the latest dates that tasks can happen and the project still finishes on time.  This table gives the same sort of information that is generated on the forward pass and backward pass on the PERT chart.

The cost table gives all the cost information, whether it is the fixed cost, the current cost, baseline and variance in costs.  (The variance can only be calculated once the baseline has been set.)

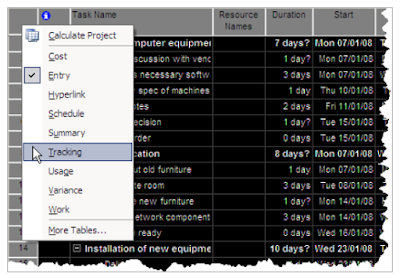
The tables can be selected from the View menu or by right clicking in the top left hand corner of the table.


If none of the current tables meet your requirement exactly then the tables can be amended to meet your exact needs.

The existing tables can be changed, a new table can be created or a copy of an existing table can be generated.

Be careful of changing or adding to an existing table as this will then have a knock on effect on the reports and views based on this table.  If fields are added onto an existing table then a report that would fit onto a width of one sheet of paper might now overflow onto the next sheet.

Microsoft Project Table - Design

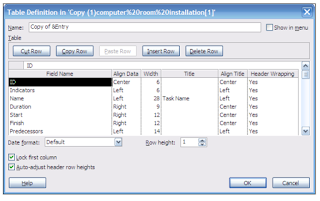
Columns in the table can be deleted by

1. Selecting the field to be removed

2. Clicking on the Delete Row Button.

The order of columns can be changed by

1. Selecting the field to be moved

2. Clicking on the Cut Row Button.

3. Selecting position of field

4. Clicking on Paste Row Button.

Columns can be inserted by

1. Select the position

2. Click on the Insert Row

3. Click on the dropdown arrow and select the field required

Align Data sets whether the data appears on the left, centre, or right.  Text is normally aligned left and numerical data aligned to the right.

The column width can be set here, though it would probably be easier to set the column width by using the best fit method of double clicking at the end of the column.

Titles can be set for the columns where the heading needs to be displayed so that it is different to the field name.

Date format allows you to choose how the dates are displayed for that particular table.  If the setting is left at Default, then the display setting is taken from Tools, Options, View Tab.

Lock first column prevents the first column from scrolling off the edge of the screen.  This is the setting that controls the task id always being visible on the tables.  When a column is locked it cannot be edited.


Microsoft Project - Tables - Customising Tables

Customising Tables 

Tables can be customised as necessary, but before making changes you need to decide what information the table should provide so some planning needs to be carried out before hand.

Tables can be customised by

1. Select the View menu,

2. Choose Table:xxxxxx, where xxxxxxx represents the name of current table being shown in the current view.

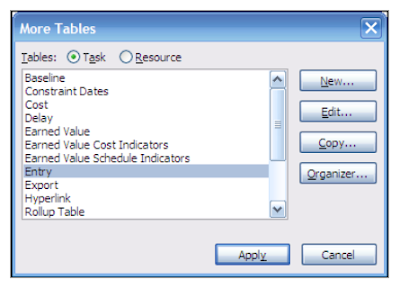
3. From the sub menu select More Tables


New – allows you to generate a totally new table where every field needs to be added to the table.

Edit – allows you to change an existing table where fields can be added, removed or the order of the fields changed.  This will also have an impact on any views and reports based on this table.

Copy – takes a copy of an existing table which can then be changed in the same way as editing a table, but as this is not an already existing table, it will not have any impact on any other facets of Microsoft Project.

Microsoft Project - Tables - Copy Existing Tables

Copy an existing table 

When a new table is required the new option can be selected from the More Tables dialog box, but then every field would need to be added, chances are that one of the existing tables would probably provide a good basis to the new table so that fields such as the ID field and task names don’t need to be added.

1. Select the table to be copied.

2. Click on the Copy button.


As default the name of the new table is Copy of xxxxxx, where xxxxxxx is the original table name.  The new table needs to be given a new name.

If the new table needs a menu shortcut key, then type an ampersand before the letter you wish to have as the shortcut key.  This underlines the letter in the menu system

Is the new table going to be one that is used regularly?  If it does, then tick the Show in menu tick box.  Otherwise the new table can be accessed via the  More Tables dialog box.

Microsoft Project - Resources - Task Types

Task Types 

Task types need to be taken into consideration when the resource units are changed.


The basic formula to calculate the work is

Durations * Units = Work

The default settings try to keep the work constant once it has been calculated.

If a resource has been added to a 2 day task, then the work will be calculated to 16 hours.  Should the resource units be changed to 50% the duration would automatically be changed to 4 days.  (So that the resource would be doing 4 hours each day for 4 days to keep the work at 16 hours)


To change the task type 


1. Double click on the task

2. Select the Advanced tab

3. Select the Task type required


Where a resource has previously been allocated to a task

Fixed Units (default) – on changing the units the Duration will change.

Fixed Duration – on changing the units the work will change.

Fixed Work – on changing the Duration the units will change to keep work constant.

Effort Driven? 


When further resources are added to tasks how should the work be shared out.  The default setting is effort driven, which means that by adding a second resource the duration will be reduced as the work is being shared out between the resources.  If by adding a second resource the duration shouldn’t change, such as a drive to Manchester is not going to half in time by having 2 drivers in the vehicle, then the task should not be effort driven.

The setting for effort driven is a tick box next to the task types.

Changing settings 


The default settings can be changed in

Menu, Tools, Options, Schedule Tab 


The default task type and whether tasks are effort driven can be changed for the project.  The changes will only apply to any new tasks that have been added after the changes have been made.  The tasks take the settings that are set when the tasks are created.

If the new settings should be standard on all new projects then click on the Set as Default button.  By setting as default, this will not change the settings for any project plan that has already been created.


Microsoft Project - Resources - The Project Plan

Resourcing the Project Plan 

Once the tasks have been setup, the project needs to be resourced as to who is doing which task when.  (If you need this information).

To be able to use this facility within Microsoft Project.

The resources need to set up

Costs need to be allocated to resources

Resources need to be allocated to tasks

Resource over allocation considered

Set up Resources 

Resources need to set up on the Resource sheet.  Change the view by

Menu, View, Resource Sheet.

Here the resource information can be entered for how ever many resources required. The information that needs to be provided is


Microsoft Project Resources - Task Information

Resources in the Task Information 

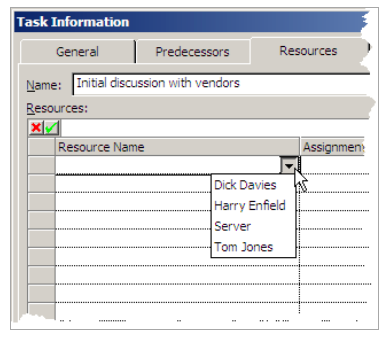
Resources can also be assigned to task in the Task information dialog box.


1. Double click on the task

2. Select the Resources tab

3. Click on the drop down arrow

4. Choose the resource required

Multiple resources are added on sequential rows

Sunday, 27 January 2019

Mouse Course Evaluation Form


Microsoft Office Skills TNA Forms

Microsoft Office Skills TNA Forms


Need help choosing the correct course?

We have put together a skill sheet for the most popular Microsoft Office Packages

Click on the links below, the skills form can be completed on most platforms

Once completed your results are automatically sent to our training team where we will advise which course (s) maybe best suited for you to attend.

For those corporate teams we can tailor the questions to your requirements.

The individuals results can be shared to you automatically - as well as a summary of results are collated into an Excel spreadsheet making course organising far simpler than pen and paper.


Click to enter

Excel Skill Form
Word Skills Form
Access Skills Form
PowerPoint Skills Form
Visio Skills Form
Project Skills Form
Outlook Skills Form


Friday, 25 January 2019

Microsoft Project - Resourcing - Resource Costings

Costings 


Do you need to cost the project?  

Is this the package in which you want to hold the information?

(If the person can open the file, they can also see all the information – costings might be confidential information that you want to restrict access to.)

Do you wish to have the costing information or the charging info?  
These questions need to be answered before Microsoft Project should be used for costings.

Task or Resource Cost 


Is the cost associated with a task or a resource?  When deciding how the cost figures are to be entered decisions need to be made as to how detailed the resource list is going to be.  

Is every particular cost going to be listed as a resource or will some costs be entered a single cost figure against the task.  Within Project a task can only have one fixed cost – but the single fixed cost can be a link to an Excel Spreadsheet where the individual items can be manipulated.

Cost Table 

If the project plan has been resourced, and the resources have costs allocated to them, the tasks will have a cost figure against the tasks.

The cost figure will be generated from  cost rate*hours worked

This will be calculated from each resource on each task.

If a fixed cost needs to be entered against a task then it can be added intro the Fixed Cost column against the appropriate task.

The accrual method can be typed in as well.


Any fixed cost that is entered will also be included into the Total Cost column as this is a combination of Fixed and Resource Cost.

Resource costs 

The resource costs are calculated in different ways depending on the type of resource it is.

Work is a multiple of rate and hours worked.

Material is a multiple of quantity of units and cost per unit (entered on the resource sheet).

Cost, here when a resource of this type is entered, the cost associated with it is also entered either on the Task information or the Assign resources dialog box.


Microsoft Project - Resourcing - Assign Resources

Assign Resources 


1. Click on the Assign Resources icon

2. Select resources required

3. Click on Assign button.


Multiple resources can be selected by using the Control key to highlight the resources.

Once the resources have been allocated, the next task can be selected without closing the Assign Resources Dialog Box.

Microsoft Project Resourcing - Allocating Resources to Tasks

Allocating Resources to Tasks 

Once the resources have been set up they can allocated to the tasks that they need to do.  This can be done in several different ways.  But before the resources are allocated to the tasks, the project manager needs to decide what sort of information needs to be extracted.


Who is doing what task.

Or  

How much work is each person doing on each task they are working on.

If it is just a name required against the task, then the resources are allocated by just specifying who is doing which task, but if the work is required (or the resource cost), then the effort needs to be specified as well.

The resources are allocated on a task view, such as the Gantt Chart.

Allocating in the Task Sheet 

The resources can be added to the resources on the task sheet by

1. Select into the cell in the resource names column

2. Click on the drop down arrow

3. Choose from the list of resources


If multiple resources need to be added then the names need to be separated by commas

Microsoft Project Setting a Project Start Date

Setting the Start Date of a Project plan. 

To start a project plan you need to provide some basic information.  This is done by setting the project information, and can be accessed by:

Menu, Project, Project Information.


The items to be considered on this screen are:

1. The start or end date of the project.  Enter the date that you will hopefully working from or towards.  Only one date can be set, the other is calculated from all the other information that you provide.

2. Schedule from.  Are you planning from a start date or towards an end date.  The option selected here is the one controls whether you can enter a start or end date.

3. Calendar.  What calendar is the Project going to be calculated on.  There are three default calendars, standard, nightshift and 24 hours.  The calendar selected here does not have to be used for the whole project plan, but it should be the one that is used the most.  Certain resources and / particular tasks can be done to other calendars.  The calendar values can be changed as necessary.

Microsoft Project Set The Calendars

Set the calendars 

When you first start using Microsoft Project the default settings on the software are an eight hour day and a forty hour week.  

If you do not need to resource cost the project or exact working times for the project plan, then whether you plan on a forty hour week or a thirty seven and a half (or any other value) doesn’t really matter as the information required is on dates.  In which case you do not need to worry about the exact hours on a day by day basis and you will only need to add the non working days ie the bank holidays.

If you do need to resource cost the project plan or need exact hours to be worked on each task then it is very important that the calendar reflects accurately the hours scheduled to be worked.

To make changes to the standard calendar for the project plan:

Menu, Tools, Change Working Time


At the top, make sure the calendar that needs to be changed is selected.  As default the calendar that is selected in the project information is the one that is displayed automatically.

Bank Holidays or Non Working Days 


To enter non working days into the calendar

1. Select the Exceptions tab on the Change Working Time Dialog box.

2. Click on the date of the non working day

3. On the exceptions tab type in the name of the non working day, such as New years day.


5. Select Working Times

6. Either change the Working Times as necessary or highlight the row to delete the times.  If the top row is deleted it will automatically move the row below up.  (This used to have to be done manually in earlier versions of Project.)

7. Click OK to return to the previous screen.

Change the Size of the Working Day 

If the size of the working day and week need to be changed, then this can be done on the Work Weeks tab in the Change Working Time Dialog box.

1. Click on the Work Weeks tab

2. Select [Default]

3. Click on Details


4. Highlight the days to be changed by clicking on the first one, holding down the shift key and clicking on the last one.

5. Change the setting on the top left to specific working times

6. Change the hours.

7. Move off the cells changed (if you don’t move off the last cell changed, then that change will not be made, even though the other ones will)

8. Click on OK

This changes the hours to which any tasks will be applied.  It does not change the size of the day that is used to calculated the duration of the task.  It is very important that the two correspond correctly otherwise the software will not plan the tasks correctly.

To change the size of the working day can be done via the

Menu, Change Working Time, Click on the OPTIONS button

or

Menu, Tools Options and the Calendar Tab.

Both options take you to the same screen, where you need to enter values so that they match the settings that have been entered on the Change Working Time.  

This should only be done for the calendar that is the default calendar for the project.




Microsoft Project Creating Base Calendars

Creating Base Calendars 

The Project might need more than one calendar

Sometimes certain resources work different hours to others.

The project might be a multinational project

Certain tasks can only be done at certain times

As many calendars as necessary can be created.  The calendars created will only be in the project file they are created in.

They can be copied over to other project files or to the standard template.
To create a new base calendar

1. Menu, Tools, Change Working Time

2. Click on the New Button


The new calendar can be a totally new calendar or a copy of an existing calendar.  It depends on whether the non working time that has been set for one calendar need to be applied to the new calendar or not.

The calendar needs to be given a relevant name and then once the calendar has been OKed, then the changes required to the calendar can be made as discussed before.

Tuesday, 22 January 2019

Microsoft Project - Reports Creating New Reports

Creating New Reports 

New reports can be created in the sixth category of custom.  The new reports can be totally new reports or copy of existing reports.


Copy Reports 

1. select the report to be copied,

2. give it a new name

3. edit as normal

Create a New report

1. Click on the new button

2. Select type of report required


3. Give the report  a name

4. Choose the Table and Filter that the report is to be based on.

Tables control the combination of columns displayed.  Filters control which tasks /resources are shown.


5. The report can be fine tuned by using the details and sort tabs.  (Be careful of adding too much detail as this can make the report look too cluttered.)

6. The period option on the definition will allow you to set whether the report is a simple list (entire project)  or whether the period is broken down by weeks, months etc.

This report can be selected via the custom categories.


Microsoft Project Reports - Customising Reports

Customising Reports 


Reports can be customised where the report can be seen.

1. To display the reports go to Menu Reports, Reports

2. Select the category of reports required


3. Select the report and then click on the edit button
.
This gives you information as to how the report is put together.

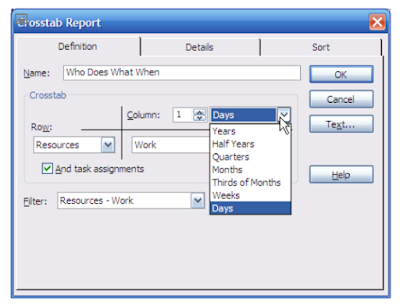
The definition is where the main details of the report are.  In this example the report shows which resource is working on which task when.  From the definition the report is broken down on a day by day basis.  It can be changed to weeks, months qtrs etc. Details and Sort will allow you to fine tune the report as necessary.

4. Make the adjustments as necessary.

5. OK the changes.  This takes you back to the previous screen.

6. Select the report to view the changes.


By changing the existing reports they can still be accessed via the five categories of reports.


Microsoft Project - Reports - Printing Reports

Printing reports 

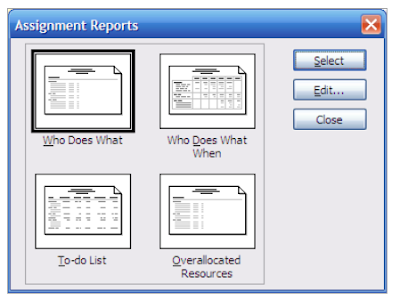
Reports are already set up in Project.  They come in five categories from where a report can be selected. 

They can be accessed by 

Menu, Reports, Reports 


Then the type of report can be selected by double clicking on the section required. 


The required report can be selected. 

Notice the picture that is visible for Cash Flow, it is different to the others.  Cash flow is a cross tab report.  Whereas the other reports are list reports. 

The list reports are based on tables to control the combination of columns being displayed, and filters to control the tasks being displayed. 

By editing the reports the order in which the tasks are listed can also be changed. 


Microsoft Project - Reports - Printing Tables

Printing Tables 

Sometimes just the table is required without the Gantt Chart.  This can be achieved by changing the view to the task sheet and choosing the table required.

The advantage of choosing the correct view is that all the print settings are already set rather than having to change them.

Microsoft Project - Reports - Printing Views

Printing Views 

Any of the views can be seen as reports by clicking on the Print Preview.  Always check how many pages it will print on before printing a view.

If the project is several years long then it would probably print several pages across.  This can be reduced by Zooming out and changing the timescale to something more suitable.

If there is an extensive range of tasks within the projects – do you need to see all of the tasks on the print out.  The number tasks displayed can be changed by filtering the tasks or collapsing the project plan as necessary.

A calendar might need to be printed so that it only shows the tasks for a particular person.

Microsoft Project - Reports -Saving Reporting Data

Saving Reporting Data 

If data is to be saved in other formats, then on the visual reports dialog box
Click on Save data


Here you can decide whether to save an OLAP cube or as an Access Database.


Microsoft Project - Reports - Visual Reports

Visual Reports 

This is a new feature in Project 2007, but to be able to use this feature you need .net framework 2, Excel 2007 and Visio 2007 installed.  If you do not have these installed they will not work.

The advantage of using Visual reports is that the reports can then be manipulated in Excel using pivot tables and charts and Visio.


Create the Visual report 


1. Menu Reports, visual reports

2. Select whether to see Excel, Visio or both type of reports

3. Select report required in either the all categories or from the type of report required.

4. Click on View

This opens up the report in Excel or Visio where it can be manipulated independently.


Monday, 21 January 2019

Microsoft Project - Filtering - Autofilter Limitations

Autofilter limitations 

Autofilter is a very useful and easy facility to use but it has its limitations.  The problem with Autofilters is that you can only filter on columns that are visible.

For instance if you are viewing the standard project data then the over budget tasks cannot be shown by using the Autofilter.  To display the over budget tasks the table would have to be changed to the cost table, before the variance column could be used to filter on.

If the criteria has to be applied on more than one field then the Boolean operator applied between the two parts of the criteria will always be AND to option is not available to change it to OR.

Microsoft Project- Filtering - Autofilters

Autofilters 

Autofiltering is the easiest way of filtering data.  It will give you drop down options available on each column in the table.

To turn on Autofilter  click on


Then data can be filtered on any column that is in the table.  The drop down options will vary depending what field is selected.

Once an option is selected then only the tasks that meet the criteria will be visible.  The field heading the drop down arrow will be appear in blue so it is possible to see which field is being used to select the tasks.  If a more complex selection is required then more than one field can be used.

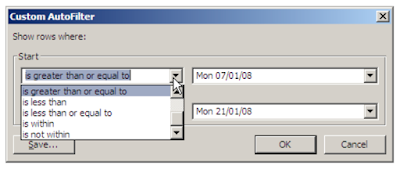
If the criteria option required is not visible on the drop down then a more complex criteria can be used by using the custom option


1. select the comparison required

2. enter the value to be compared against

3. if a range is required then select AND, if two options are needed then select OR then enter the second comparison and criteria values

4. If this criterion is to be used regularly then the Autofilter can be saved as a normal filter

To remove an applied filter – click on the drop down and select the all option

Microsoft Project - Filtering - Customising Filters

Customising Filters 

If none of the current filters meet your requirements then the current filters can be changed or  new filters can be set up to meet your requirements.

The only filter that cannot be changed is the Using Resource filter, the reason for this is the drop down list that comes from the resource sheet and is programmed in rather than by using the Customising filter facilities within Microsoft Project.

The options are: 

New – allows you to generate a totally new filter.

Edit – allows you to change an existing filter, normally where minor adjustments need to be made.  (If the changes were major then the name would probably need to be changed!)

Copy – takes a copy of an existing filter which can then be changed in the same way as editing a filter.


Microsoft Project - Filtering - Filter Design Explained

Filter Design Explained 


The different parts of a filter are:

1. Field Name – this is field that needs to be analysed when deciding which tasks need to be selected.

2. Test –the test that needs to be applied to the field.

3. Value – the comparison value against which the test needs to be applied.

4. And / Or – If there is more than one comparison that needs to be made, what logical factor needs to made.


In the example above the filter definition tells us that this filter is made up as:

The current cost value is larger than the baseline cost

And

Baseline Cost does not equal £0.00 (nothing).

This filter will find all the tasks that now cost more than original cost, as long as the baseline as been set.

The second row is necessary, otherwise everything would be over budget if no baseline is set.

Creating a new filter 


A new filter can be created by:

1. Project Menu,

2. Filtered for

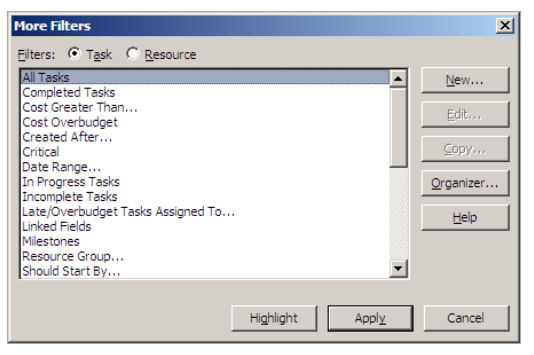
3. More Filters

4. Click on the New button on the right hand side of the dialog box

This brings up a blank filter definition.


1. Give the filter a relevant name

2. Decide whether it is to be used regularly.  Tick the Show in menu box if necessary.

3. Choose the field that is going to be used to select the tasks.

4. Select the appropriate test from the drop down list.

5. Enter the value to be tested against.  (This can be another field, an exact value or a parameter.)

6. Repeat steps 3 to 5 if more that one comparison is to be made, remember to select the And / Or to define how the different criteria are to interact.

7. Click OK to go back to the previous screen where the new filter can now be applied or highlighted.


Microsoft Project - Filtering - Highlight Filters

Highlight Filters 


When the project has been filtered, the tasks displayed are restricted to the ones that meet the criteria of the filter.  Sometimes it is useful to be able to see the whole project plan, and also the tasks that meet a criteria. – this is known as a Highlight Filter.

To be able to highlight in this way, then on the filter menu select more filters.


Select the filter required, but rather than applying the filter, select the Highlight button at the bottom.

Microsoft Project - Filtering - Interactive Filters

Interactive Filters 


Interactive filters allow you to provide the comparison data at the point of running the filter and so can be changed every time the filter is run.

There are several interactive filters set up as standard within Microsoft Project.  They are displayed with … at the end of the name of the filter.

When an interactive filter is run, rather than just finding the tasks that meet the criteria being shown, the dialog box asking for the comparison data is displayed instead.


Once the data is provided the filter then works as any other filter.

The parameter in the value column is what makes it into an interactive filter.


The format of the parameter is

“Question text”? 

The question can be phrased in any way, the text itself is not important – it is the field name and the test that control the filter.  The text cannot start with a space or be a field name by it self (it could be a field name with some other text added at the end).

The question needs to be enclosed with in double quotes and have a question mark at the end.

Microsoft Project - Filtering - Why Filter Data

Why filter data? 

You have set up your project plan, had it agreed by the sponsor and saved a baseline. But what do you do with all that data?

Do you always want to deal with the whole project?

If the project is three or four years long do you always want to print the whole thing?

You are going into a meeting to discuss a particular phase of the project, does everyone need to see the other one hundred and fifty tasks that have nothing to do with the subject to be talked about?


The advantage of planning a project on Microsoft Project is that you can then analyse the data and extract information that you need.  Rather than dealing with the whole project you can select whatever information you need

See the tasks being done by a particular resource

Which tasks have been completed

Where the project is falling behind schedule

Where is the project going over budget


A project plan can be filtered to extract data against a particular criterion by:

Making selections against particular column heading options

There are standard filters that have already been set up

New filters can be designed against the standard data that has been entered in the project plan or customised data that you need to store.

Saturday, 19 January 2019

Microsoft Project - The Basics - Opening a Project

Open a Project 

Once a project has been saved, it can be opened up again.  This can be done by using the button, or via the file menu. 

Once the open dialog box is displayed. 

1. Select the folder where the file is stored.

2. Choose the project required and then

3. Click on the open button.

The file can be opened in different formats.  The default option is 
to open so the file can be changed and can be saved under the 
same name.   

But it can also be opened up in other formats.  Should you wish to  open up in one of those formats then you need to click on the  down arrow next to the open button and select the option  required. 

Open Read-Only lets you view the file.  If you make any changes and then try to save the document, a prompt for a new name will appear. 

Open as Copy copies the file first and then opens up the copy, so if an attempt to save is made, it is the copy that is saved and no changes are made to the original. 

If the file to be opened has been used  recently, it will be listed at the bottom of  the file menu. 

The required file can be opened by  clicking on the name.  

From the recently used list the files can  only be opened, the other open options  of read only or copy cannot be activated. 

Microsoft Project - The Basics - Terms Explained

Project Terms Explained 


Microsoft Project - The Basics - Terminology

Terminology 

Project management has several terms that are related to the subject that are key in understanding the results from Microsoft Project.
It would be very difficult realizing the full benefits of the Microsoft Project without understanding them.

What is the Critical Path? 

Microsoft Project allows you to plan when the tasks (steps) are going to happen and display a sequence of them in a Gantt Chart.  As default all the tasks are shown in the same colour (blue).
By showing the project plan in this way it does not display which tasks if they are delayed are going to impact on the finish date.


The Critical Path is the sequence of tasks that if they are delayed or take longer than planned are going to impact on the finish date of the project plan.  These tasks are not necessarily the most important tasks in the project plan – just the ones that are going to setback the finish date.
Microsoft Project allows the Gantt Chart to display them formatted in a different way, and so display the critical path in a different way.


It is important to know which tasks are on the critical path so that if tasks need to be postponed for any reason, it is not the tasks that are going to impede the end of the project that are chosen.
What is the Baseline?

The baseline is the original plan of when the tasks are going to take place as agreed by the stakeholders.

It holds data on when the tasks are going to take place, how long they are going to take, how much work is involved and at what cost.


The baseline can be displayed against the current plan, either by showing all the tasks in the same way or also by showing which tasks are currently critical.


The advantages of using a Baseline 

By having this information, when the project actually starts (or changes are considered), comparisons can be made between what is happening now and what was originally agreed.

Once the project is finished, the project plan can be analysed.  This will then help improve future plans, as it will be possible to see which areas of the plan worked as scheduled and which areas didn’t.  Hopefully reasons can be given as to which areas didn’t work as they should.

Once the guide is displayed,  there are two parts.

1. The toolbar – where you can choose what stage you are in the process.

2. The guide – which lists what needs to be done.

Notice the first two steps given in the guide


The guide is not displayed as standard in Project 2007, and should you wish to use it, it needs to be turned on.

To turn on the guide

1. Menu, Tools, Options

2. Click on the interface tab

3. Select Display Project Guide in the Project Guide Settings

4. Accept changes by clicking on OK.


This turns on the project guide for all project plans until you go through and turn the guide off.


Microsoft Project The Basics

The Basics of project 

Project Management is about planning, organising and managing information.  The information can be about the things or tasks that need to be done and who or what will be used to carry them out, when are they available for this project and what will it all cost?

The project manager has to ensure that the project is running as planned within the parameters of the project.  Microsoft Project will help you to do this, but will not do it for you.

Microsoft Project is a planning and tracking tool that will allow the user to access and present information about the project quickly and in relation to any or all aspects of the project.

Microsoft Project will allow you to enter information about the tasks involved, the relationships between them, the resources allocated to particular tasks and their availability according to their calendars and will then work out a schedule for the project according to the constraints involved.  As any of the information is changed the schedule will be altered to reflect the amendments.

Information available on a project being monitored by Microsoft Project

How long will it take?

What will it cost?

Which tasks are critical?

Are enough resources available?

Who is doing what? When?

Is the project running to as planned?

What happens if a particular task is delayed?

Decisions can be made with the information available and alternative scenarios can be considered if necessary
.
Once the project is in progress it can be monitored  against a baseline (planned) schedule and comparisons can be made to the original schedule in relation to dates and costs involved.

Microsoft Project - The Basics - The Project Guide

The Project Guide 

Microsoft Project comes with a guide to help you set up a project plan.  The guide is a wizard that will take you all the way through setting up a project plan. 

It lists the steps that need to be done to set up a project plan and then track and report on it.  But as with most Microsoft wizards, it does not give all the options and facilities of the package. 

Once the guide is displayed, there are two parts. 

1. The toolbar – where you can choose what stage you are in the process.

2. The guide – which lists what needs to be done.


Notice the first two steps given in the guide 

The guide is not displayed as a standard in Project 2007 and should you wish to use it, it needs to be turned on.

To turn on the guide.

1. Menu, Tools, Options

2. Click on the interface tab

3. Select Display Project Guide in the Project Guide Settings

4. Accept changes by clicking on OK.


This turns on the project guide for all project plans until you go through and turn the guide off. 


Microsoft Project -The Basics - The project Screen

The Project Screen 


The different elements of the project screen are:

1. The Title Bar – here it will show the name of the project file.  Before the project is saved, it is known as Project1, the next project created will be Project2.

2. Menu Bar – will allow you to operate the package.  (The Menu Bar is now a special toolbar  and can be operated as such.

3. Tool Bars – where you have the shortcuts to regularly used commands

4. Entry Bar – where the changes currently be made are shown.  They can be accepted or rejected by either using the enter and escape key or by using the cross or tick buttons that appear on the left hand side.

The Gantt Chart View is composed of two parts - 

5. On the left is the Task Sheet, giving a spreadsheet like presentation of the project with all the data in cells information about one task on one row, with the same sort of information about each task in a column.

6. On the right is the Gantt Chart, which is a graphical representation of the project across a timescale.

The two sections can be scrolled horizontally independently of each other as they have their own scroll bars along the bottom; but vertically there is only one scroll bar and it will scroll the gantt chart and the task sheet together.  This is so that the tasks being seen on the gantt chart and the task sheet correspond to each other. 

On the left of the screen there are a column of numbers.  These are the id numbers of the tasks, they are used to make links or connections between tasks and are also used a shortcut to refer to a task rather than by using the full task name. 

On the top of the task sheet are the column headings (field names) such as task name, duration, start, finish, predecessors and resources names.  The fields being displayed are controlled by the current table and that can be altered depending on what type of information is currently required. 
On top of the Gantt Chart is a timescale against which the project is plotted.  The timescale can be changed to reflect the duration of the project. 
Project Basics 

Microsoft Project allows you to show a project plan graphically against a time scale that can be adjusted.


adjusted.