Access Reports Explained
Reports are for static presentation of the data. You need to consider how many pages it will print out on so unless the number of records are heavily restricted then normal layout for reports is tabular.
Reports are generated in a very similar way to forms, and in design view the changes are made in the same way.
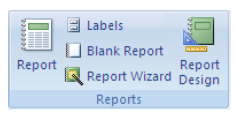
A simple report can be created by selecting a table or query that it is to be base on and then clicking on Report.

This will generate a report including all of the fields.
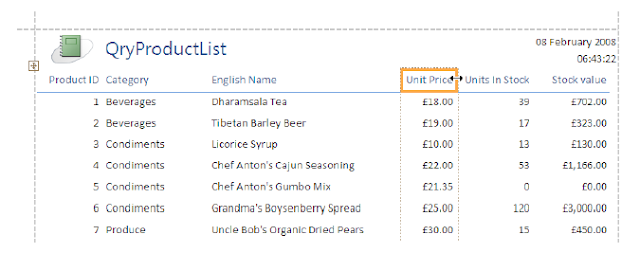
The report will be in a tabular layout going across several page widths if necessary. If the totals are shown in the table or query then there will also be a column for totals as it is treated as field. It displays the report in layout view

The field widths can be changed by clicking on the field name and then positioning the cursor on the right hand edge, then with the double headed arrow the column width can be changed by dragging. Making this sort of change is easier in layout view rather than design view as the data is also visible.

No comments:
Post a Comment