Group and Outline
Document outlines are a graphical method of hiding and showing the columns and rows in a worksheet, with a mouse click you can collapse or expand the view of sections of the worksheet to show either summary or detail data.
You can outline columns or rows or both, parts of the worksheet or the entire worksheet.
The outline symbols appear around the edge of the worksheet, you can show or hide the outline symbols.
An outlined worksheet only prints the visible cells, thus document summaries are easily achieved.
An outline is applied automatically to a list when you choose, Subtotals.
Any worksheet can be outlined either automatically or manually.
Automatic Outlining: the automatic outline will follow the structure and hierarchy of the formulas that have been entered into the worksheet cells.
Manual outlines: by selecting Manual Outlining you are able to select the rows or columns that are required to be grouped (hidden).
Creating an Automatic Outline.
1. Highlight the data that you wish to group.
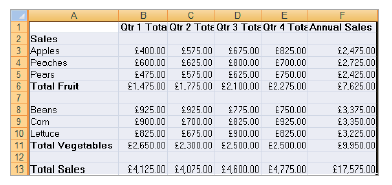
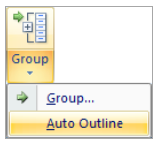
2. From the Ribbon select the Data tab → Group → Auto Outline.
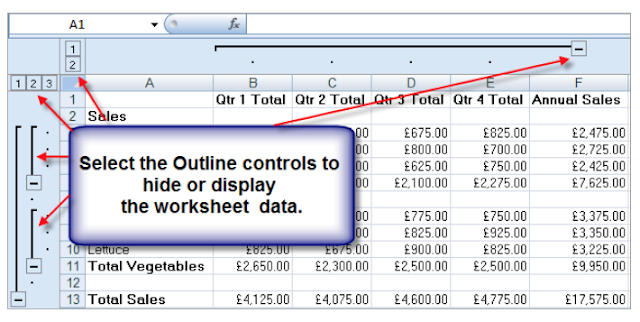
Creating an Manual Outline.
1. Highlight the columns that you require to group.
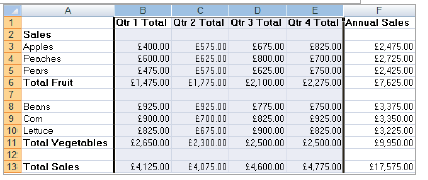
2. From the Ribbon select the Data tab → Group → Group option

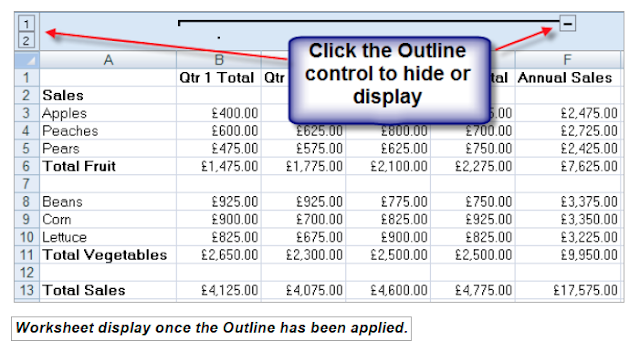
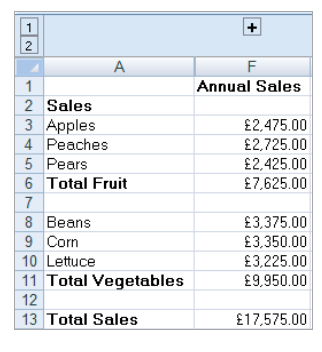
The display of the worksheet data (columns B – E) have been hidden.
Select the Outline controls to re-display hidden columns.
Note: It is possible to manually group on both Rows & Columns.
Removing an Outline.
1. Highlight the column (s) that you require to Ungroup
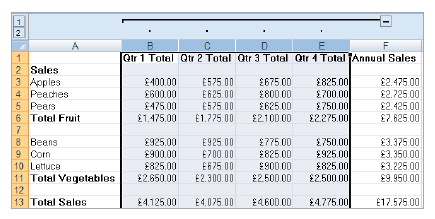
2. From the Ribbon select the Data tab → Ungroup → Ungroup option.
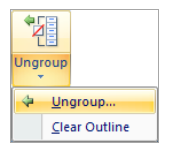
Note: When removing multiple Outlines (example from Auto Outline), highlight the data and select from the Ribbon → Data tab Ungroup → Clear Outline.

No comments:
Post a Comment